Overview
Sales reports are commonly used by companies in almost all industries. With FineReport BI and reporting tool, we can automatically create daily, weekly, monthly and yearly reports and distribute them to large numbers of managers and salesmen.
Let' s introduce some commonly used reports in the Sales Department.
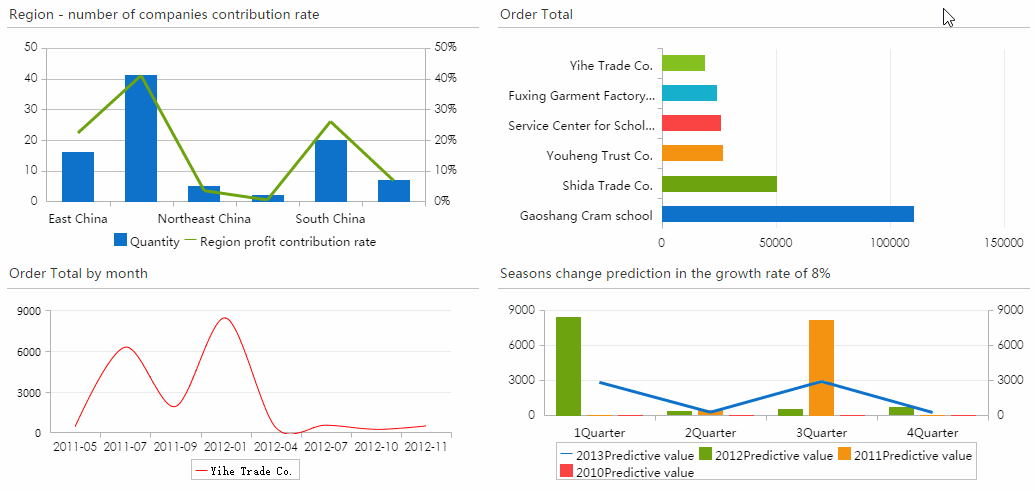
Order Analysis Report
As shown in the following figure, the chart in the upper left corner shows the number of branches in different sales regions and the profit contribution rate. With the chart linkage function of FineReport BI and reporting tool, when you click on one region in the first column chart, the next three charts will display the customers' order account, order history, and quarterly order forecast of the selected region.
Customer Rating Analysis Report
In order to understand our customers better and deliver better services in sales, we often rank our customers in terms oforder quantity, order account, etc.
Here is a typical customer rating data analysis report. Customers are divided into A, B, C three grades according to the total amount of orders. The first pie chart in the upper left corner shows the proportion of customers in each grade. Click on the grade A, the following charts behind will display the number of customers, the total amount of orders.
At the same time, this report also lists the annual changes of each grade , the number and the proportion of each grade, and monthly accounts of TOP 10 customers.

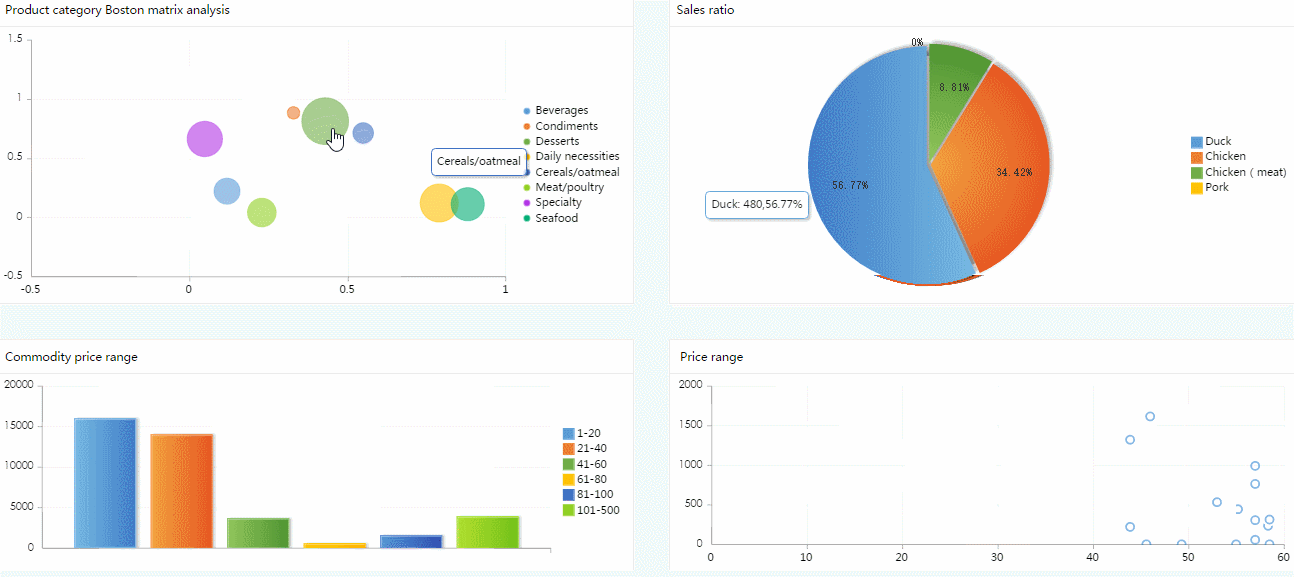
Product Analysis Report
First, we classify all the products by category and show the data in a Boston matrix chart. Click on any of the categories in the matrix and the chart on the right will show the proportion of all products in this category.
We also use a bar chart and a scatter chart to describe the distribution of product prices.
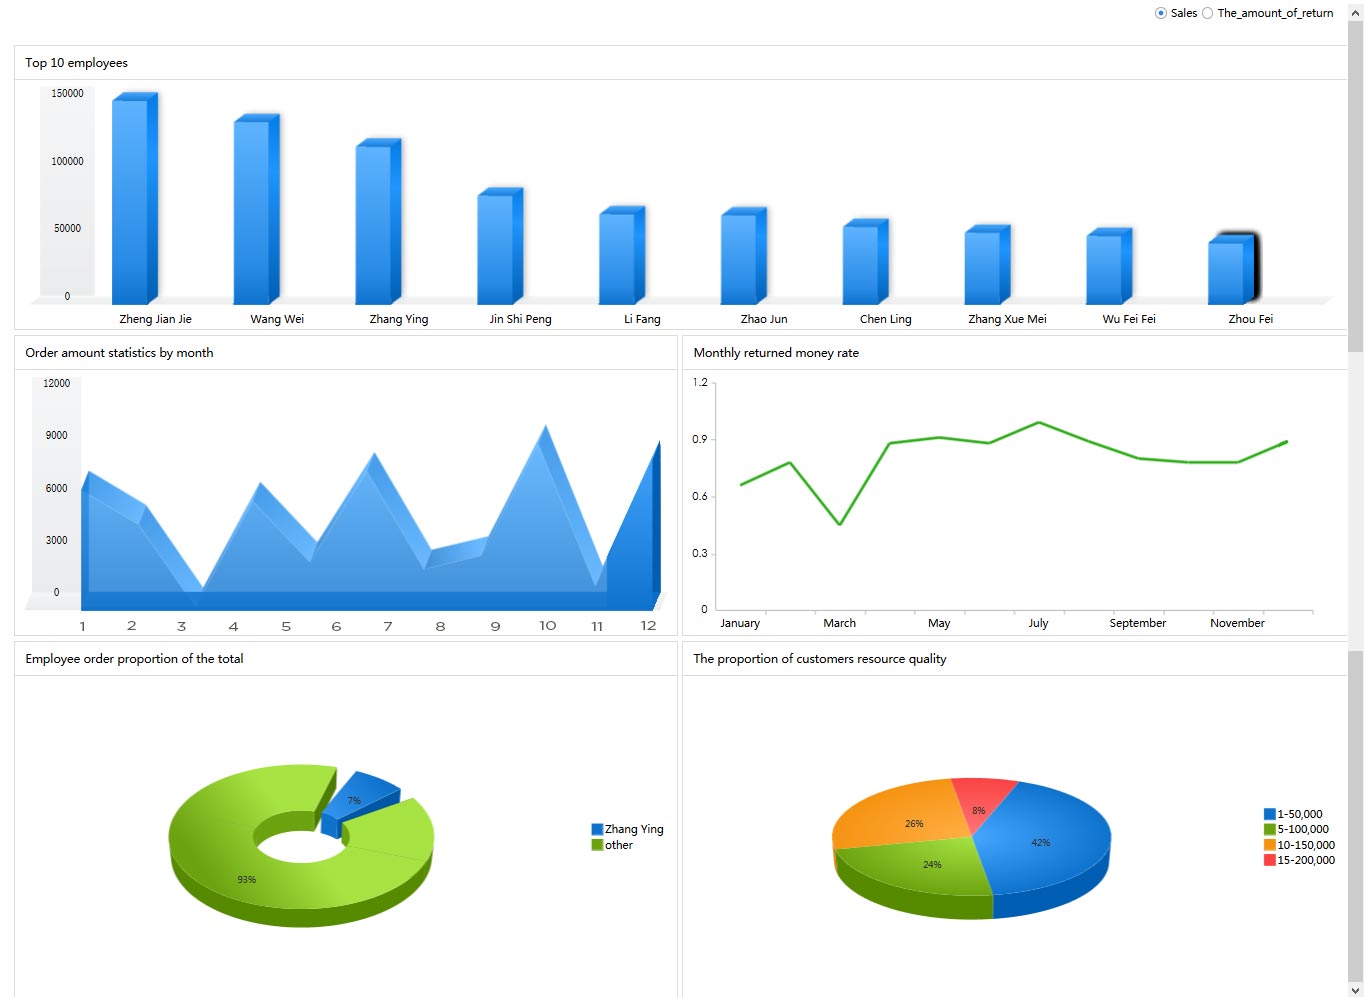
Salesperson Analysis Report
This is an data analysis report of TOP 10 salesmen.
Click on any salesperson in the first chart of money paid, the following charts will list the salesperson's monthly sales amount paid, the rate of monthly sales amount, the proportion of order amount as well as the customers' quality.
Customer Track Filling Report
When we get a new customer, we need to enter the customer information into the database. With a deep understanding of the customer, we need to promptly increase, delete, modify his information in the database.
In that case, you need to use the unique filling report of FineReport BI and reporting software. With the following filling report, the salesman can update the customer information via PC or mobile devices anytime, anywhere.

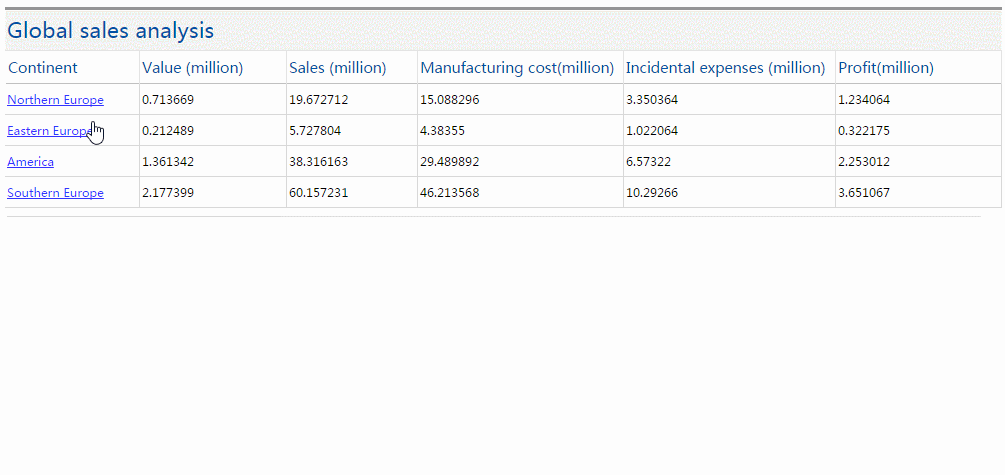
Global Sales Analysis
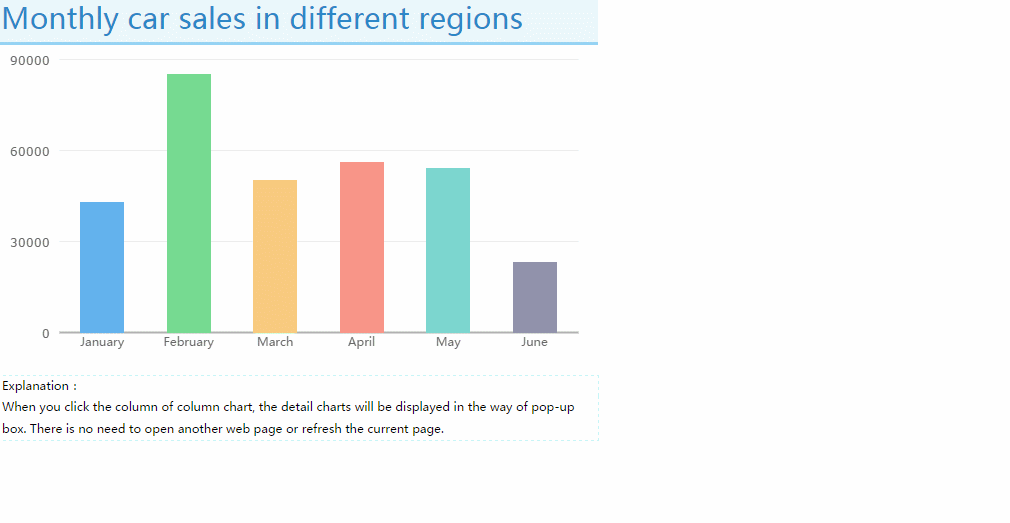
Monthly Sales of Different Regins
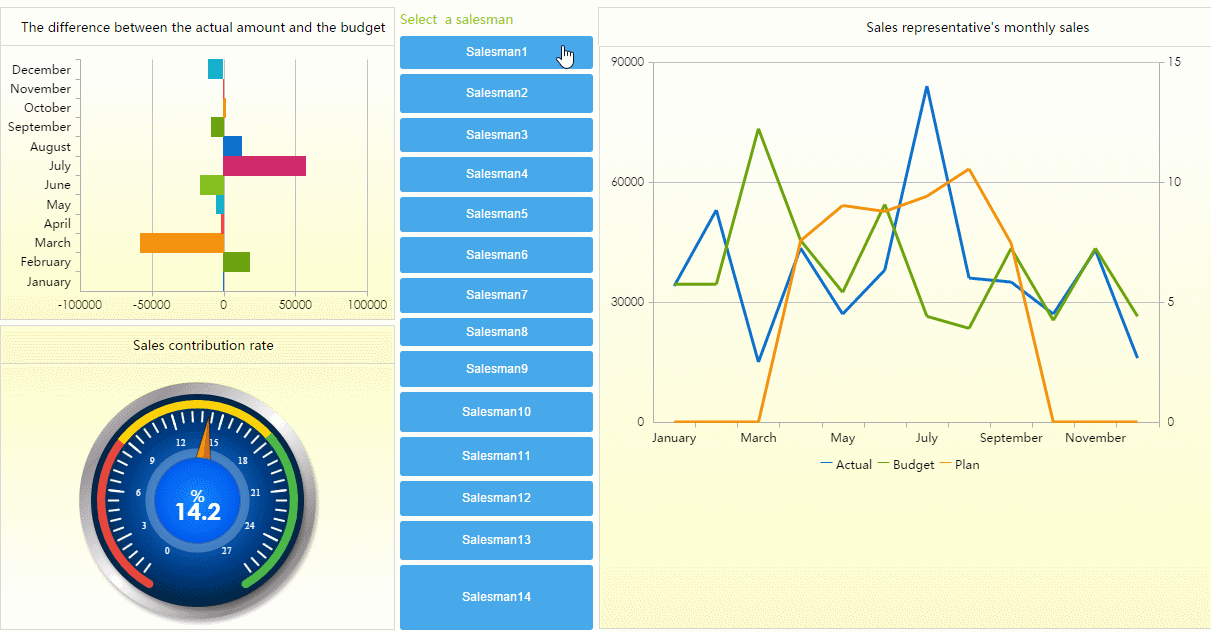
Monthly Sales of Different Salesman
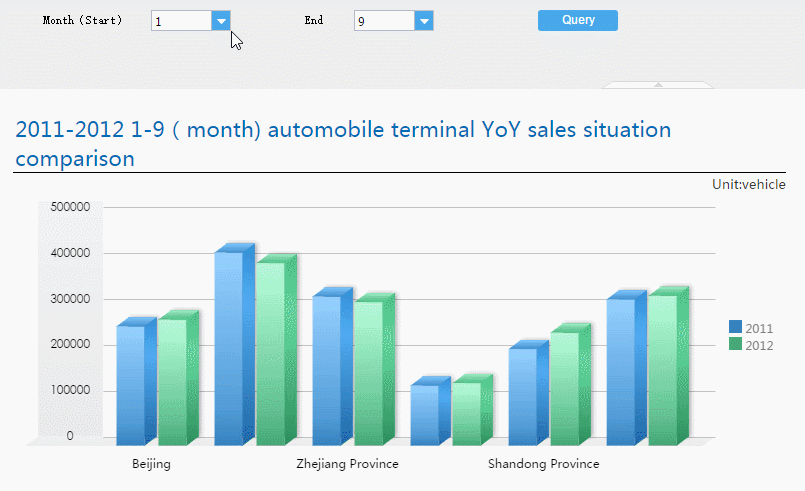
YOY Sales