Overview
The financial statement comprehensively and systematically reflects the financial condition, operating results and cash flow of an enterprise, which is helpful for the managers to know the completion of the various tasks and evaluate performance so as to discover the problems timely, adjust the operation direction and provide the basis for economic forecasting and decision-making.
In addition, the financial statements are very important for investors, creditors, as well as the financial department, tax department, auditing department and other regulators.
Using the FineReport reporting tool, we can regaularly and automatically get fixed-format financial statements, such as cash flow statements, balance sheets, etc. At the same time, we can run an extended analysis of financial data and view them timely in a visual way.
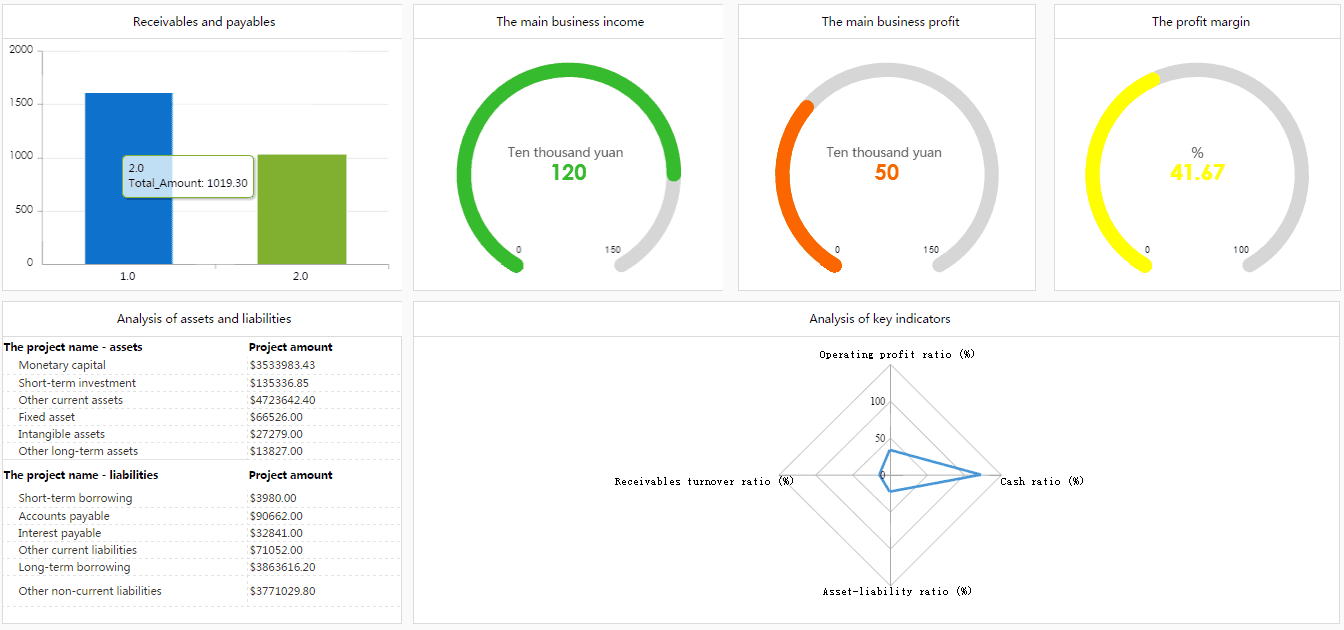
Financial Condition Dashboard
This is a dashboard of company financial condition. Key financial data are presented in a concise and visual way. It includes the accounts payable and receivable, the main business income, the main business profits, profit margins, balance sheet and key financial indicators analysis.
Cash Flow Analysis Report
The cash flow statement is one of the most common reports in the finance department. In addition to the detailed cash flow situation, we also need to quickly grasp the key information about cash flow in a visual way.
The first chart below is the proportion of cash inflows and outflows. Click on the cash inflows, the next two charts will show the compositions of it and the detailed content of each composition.
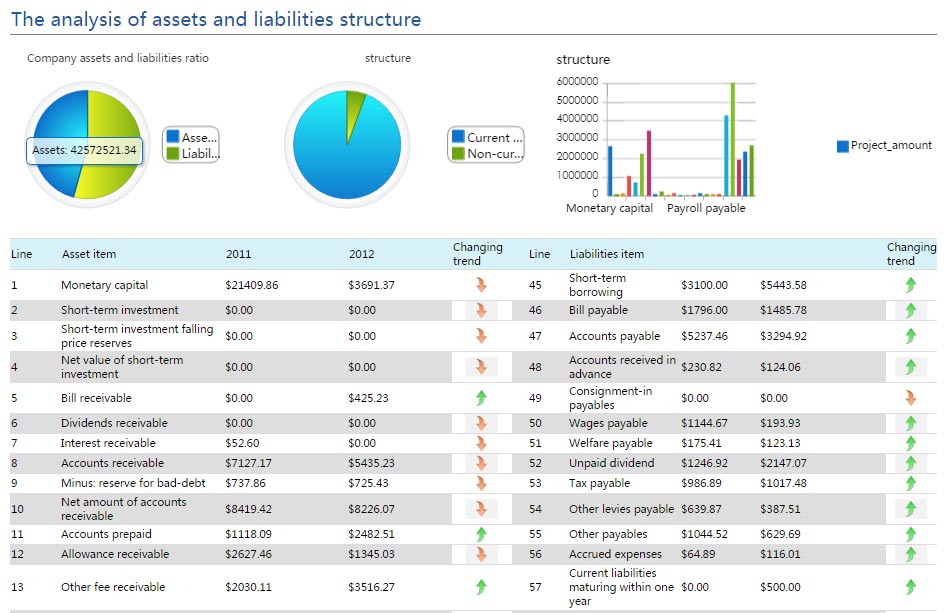
Balance Sheet
The following chart shows the structure of enterprise assets and liabilities.
Click on the Assets in the first chart , the next two charts will show the compositions of it, as well as the detailed content of each composition.
Income Statement
The chart below is the Profit Structure Analysis report. Click on the Income in the first chart, the latter two charts will show the compositions of it, as well as the detailed content of each composition.
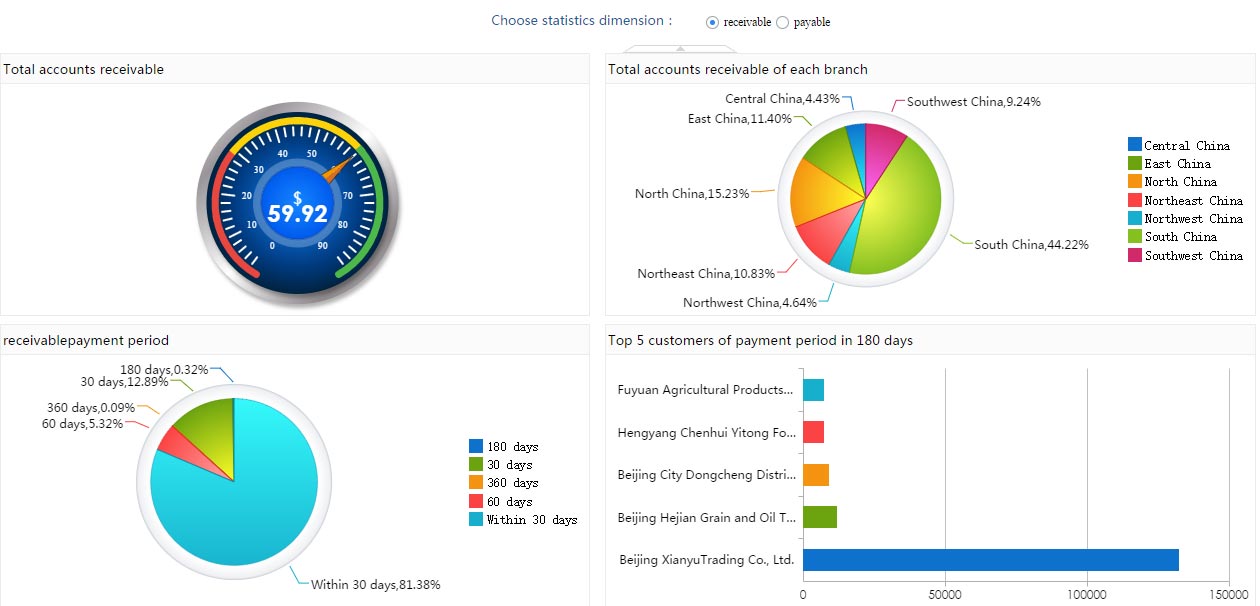
Accounts Receivable and Payable
The FineRepot reporting tool shows the total amount receivable, the account receivable of each branch, the distribution of account receivable payment period, and the top five companies of each payment period with the panel, pie chart and column chart.
Through the Statistical Dimension Button in the upper right corner, you can switch to the data visualization reports of the account payable.
Stardard Benefits Review
Product Cost Analysis
Multi-dimensional Turnover Analysis

Daily Shipping Fee Analysis
In addition to the above five basic financial statements, FineReport BI and reporting tool also supports a number of financial analysis models.
Pali Pu Analysis Model
Pali Pu Financial Analysis System is deformed, supplemented and developed from DuPont Financial Analysis System by a Harvard University professor Pali Pu (Palepu). Pali Pu said the financial analysis system of common financial ratios are generally divided into four classes: solvency ratios, profitability ratios, asset management efficiency ratio, cash flow ratio in his book of "enterprise analysis and evaluation". The principle of Pali Pu financial analysis is expanding layers of one indicator to analyze , so you can explore the root causes of the financial indicators of change.

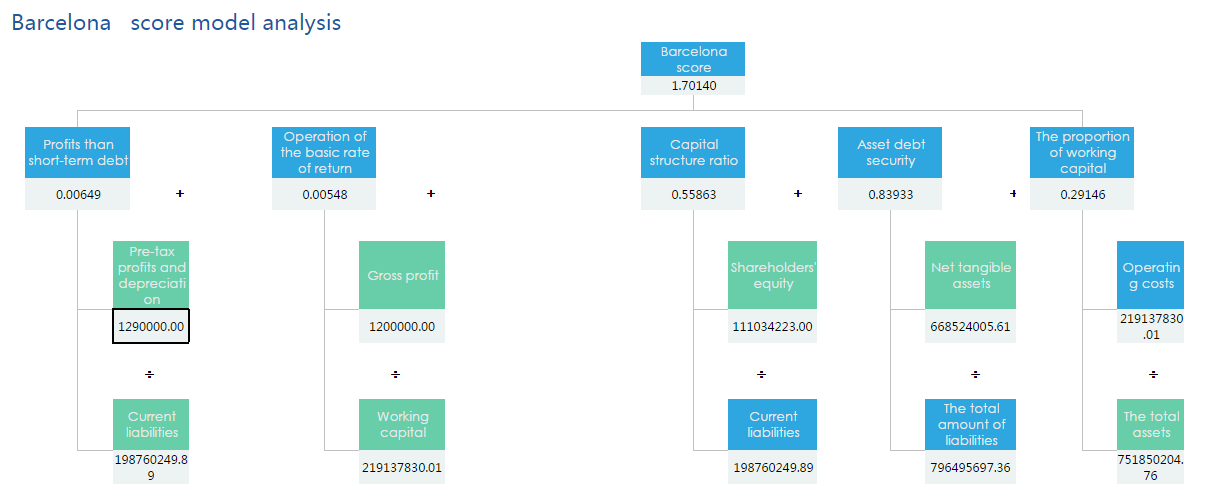
Barcelona Analysis Model
Barcelona is a kind of credit analysis model whose goal is to predict the bankruptcy possibility of customers . Barcelona model was the more general application of z-score method . According to the survey, Barcelona model's accuracy can reach 95%; Its biggest advantage is easy to calculate. At the same time, it also can measure the company's strength size and are widely used in various industries.
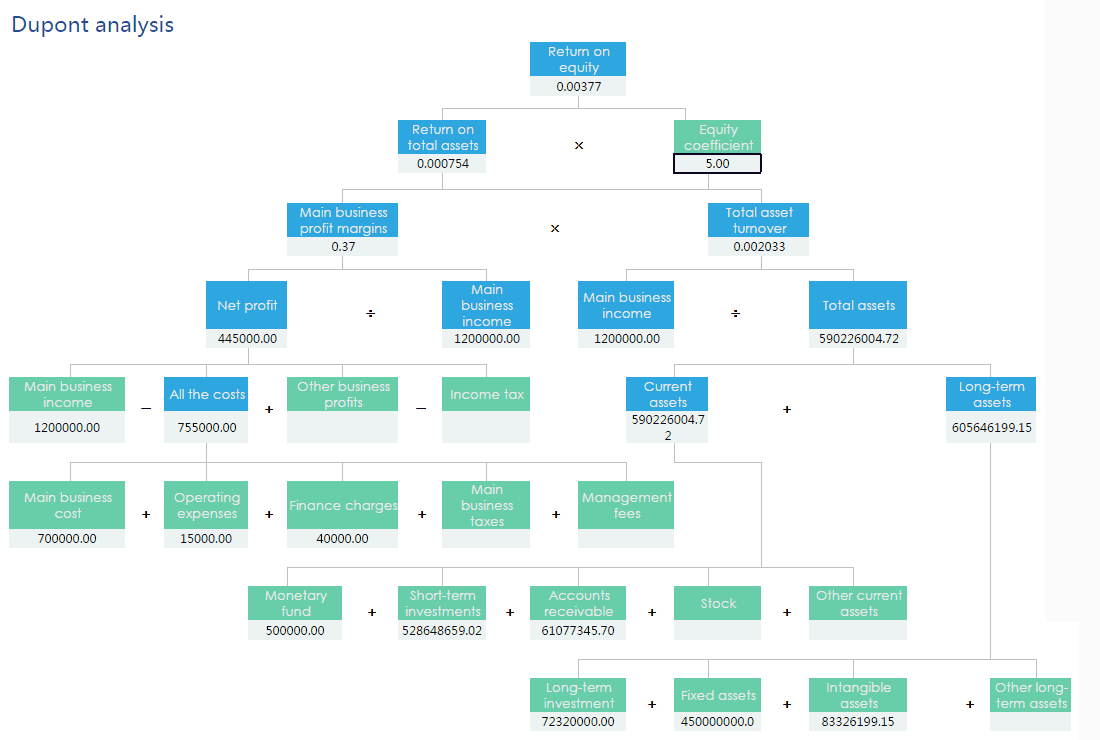
Dupont Analysis Model
Dupont analysis is to synthetically analyze enterprise's financial condition with the relationship among several major financial ratios. This analysis method is first used by the United States Dupontt, therefore the Dupont analysis. Dupont analysis method is a classical method which is used to evaluate the company profitability and shareholders' equity returns level and evaluate enterprise performance from a financial perspective. Its basic idea is to decompose the enterprise net assets into a number of financial ratios, which can conduce to in-depth analysis of enterprise business performance.
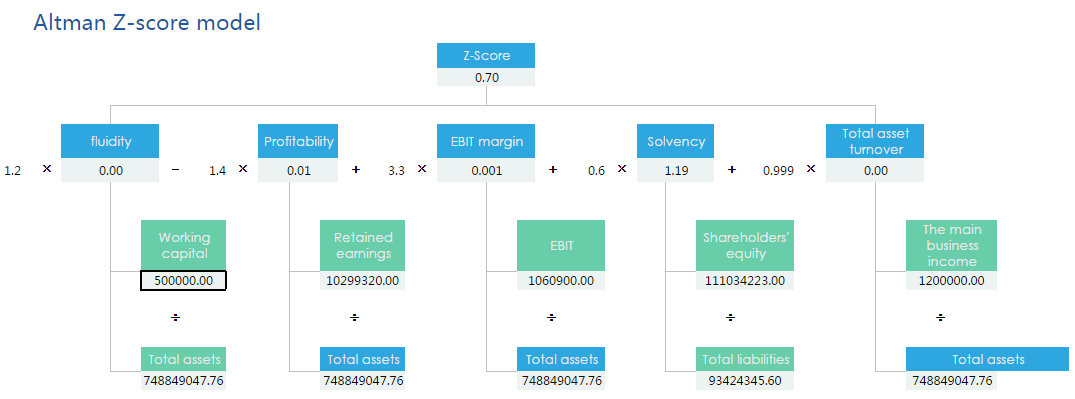
Altman Z-score Analysis Model
Z-score model is based on multivariate statistical methods. It uses bankrupt enterprises as samples. it is a discriminant system of analyzing the health of the enterprise, bankruptcy through a lot of experiments. After a lot of empirical investigation and analysis of research, Z-Score model gets a group of financial ratios from the listed company's financial report, which reflects the extent of the company's financial crisis . Then, it gives different financial crisis warning size weight by these ratios. Finally, through weighted calculation, it gets a company's comprehensive risk points,namely z values. Comparing it with the threshold, we will know the severity of the financial crisis.
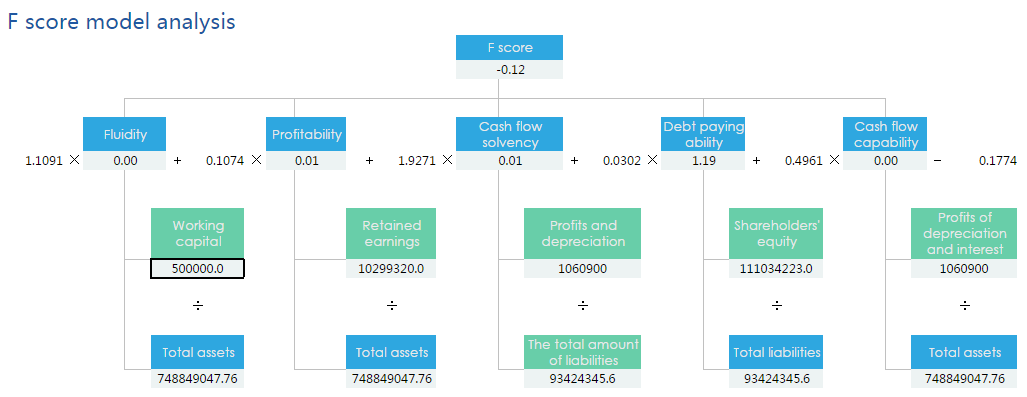
F-score Analysis Model
As an effective financial warning system, F-score model has been recognized by many companies. It fully considers the cash flow changes on the basis of Z-score model and establishes a new model of financial crisis prediction when Z-score model is modified. Five independent variables in the model are based on the theory of finance and the critical point is 0.0274; If a particular F-score is below 0.0274, it will be predicted for bankrupt companies; On the contrary, if F-score is higher than 0.0274, then the company will be predicted to continue to survive.
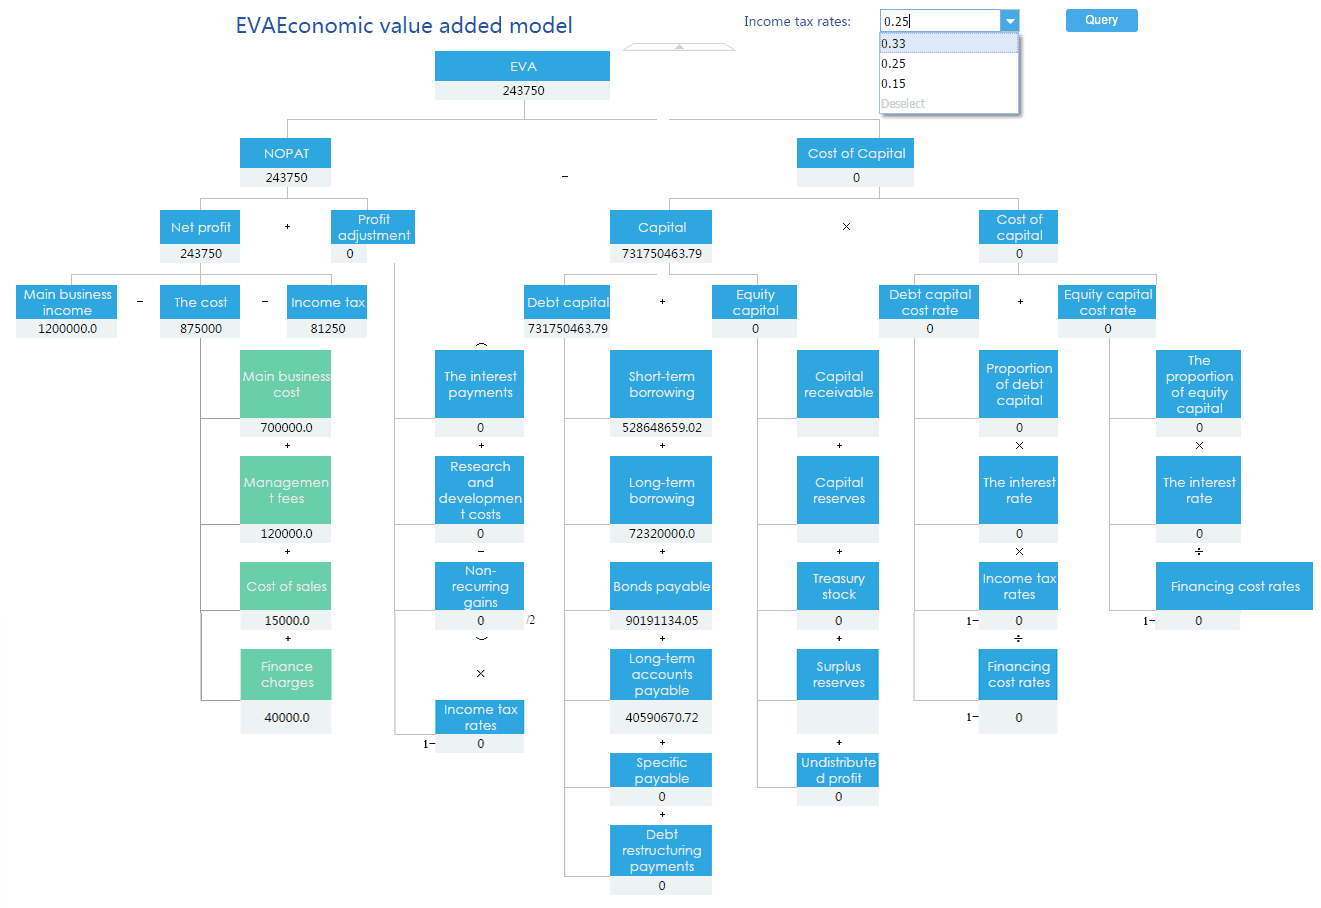
EVA Economic Value Added Model
Economic Value Added (Economic Value Added, referred to as EVA)is also called Economic Value Added, which is a set of financial management system, decision-making mechanism and incentive compensation system based on the concept of economic added value that was proposed and implemented by Stern Stewart & Co. in 1982. It is a financial enterprise performance evaluation method based on the operating profit after tax and the total cost of the capital investment needed to generate those profits. Economic value added created by company every year is equal to The difference between the net operating profit after tax and the full cost of capital. Capital costs include the cost of debt capital, also including the cost of equity capital.At present, Some of the world famous multinational company like Coca-Cola generally use EVA index to evaluate enterprise performance. In terms of arithmetic, EVA is equal to the operating profit after tax minus the cost of debt and equity,which is the remaining revenue after all costs are deducted(Residual income).EVA is a true "economic" profit evaluation, in other words, it shows a net operating profit compared with the minimum return of other similar risk securities investment with the same capital,above or below the value of the latter.
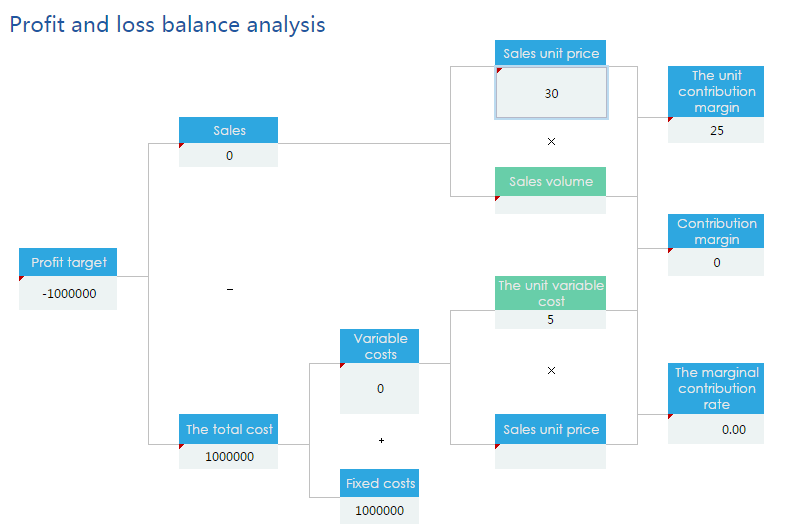
Break-even Point Analysis
Break-even point is also called zero profit point, the break-even point, the break-even point and profit and loss bifurcation, earnings turning point. Usually ,it refers to the production at the time when the total sales revenue is equal to the full cost (intersection point of sales income line and the total cost line intersection point) . With Break-even point, when sales income is higher than Break-even point , corporate profits. On the other hand, the enterprise is a loss. Breakeven point can be represented with sales volume, namely break-even sales volume;it can be also represented with sales, namely the break-even point of sales.